
This Post has been Updated..
The below example shows the how to simulate multiple series drill down in Xcelsius
How to do it
The below example shows the how to simulate multiple series drill down in Xcelsius
How to do it
Step 1:
Take a column chart and map the yearly data by using the “by range (data in rows)”.
Then you need to click on “by series” the chart will shows the yearly data.
Step 2:
Go to “DRILL DOWN” tab and check the “Enable Drill Down” check box…
Here you need to do carefully
A) Here we have to bind “Series Name Destination” to Sheet1! $G$1 cell(in fig1), It throws the Series name ‘a’,’b’,’c’.
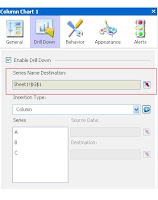
B) then the next step is Insertion type select insertion type as column. Click on Series “A and bind the source data with the Years(2007,2008,2009) and we need to do same for the B and C Series also. But we have to bind the destination of each series with different cells
Stpe 3;
Then come to Excel spreadsheet concatenate series names, we use this concatenated key as a search key for the monthly data (Fig2)
Then come to Excel spreadsheet concatenate series names, we use this concatenated key as a search key for the monthly data (Fig2)

Please Don't hesitate to comment it..
dear srinivas,
ReplyDeletenice trick you made here. very usefull for me, but i think a found an anomally, when i clicked the 2009 C series, and the clicked the 2008 C series, there seems to be no change in the line chart. CMIIW.
Good method, but does not work completely.
ReplyDeleteWhen you drill down, the graph only shows the results for the year last selected by Series "A". This is because the MATCH function in the INDEX function only looks at G1&H1.
While the Series name changes in G1 with every drill down, H1 only changes when Series "A" is selected.
Maybe this can be solved using IF functions, where if H1 is blank, it looks at H2, then at H3.
Hi Thanks for the comment .. I will have a look on to that and update the same .
ReplyDeleteThe Blog post has been updated and corrected the logic..Thanks for your support ..
ReplyDelete