
Xcelsius 2008 Service Pack 3(SP3) is now available and posted on the SAP BusinessObjects download support site. You can access it here:
Showing posts with label Xcelsius 2008. Show all posts
Showing posts with label Xcelsius 2008. Show all posts
Tuesday, December 15, 2009
Xcelsius 2008 Service Pack 3(SP3)
Thursday, November 26, 2009
Xcelsius Enterprise 2008 Fix Pack 2.1 is now available
Xcelsius Enterprise 2008 Service Pack 2 - Fix Pack 2.1 (FP 2.1) is now available and posted on the SAP BusinessObjects download support site. You can access it here: http://www.sdn.sap.com/irj/boc/downloads
It applies to Xcelsius Engage, Engage Server and Enterprise. Not Xcelsius Present.
You must already have Service Pack 2 (SP2) installed before installing FP 2.1. FP 2.1 installs over SP2. No uninstall or new keycode is needed. Please unzip the download before attempting to install.
Note: Before installing FP 2.1, if you upgrade from SP1 to SP2 you need access to your original SP1 installation files from the original location otherwise you will be prompted to locate Xcelsius.msi from the original SP1 installation (in the SP1 installation packages folder).
After installing in Xcelsius Help > About your Xcelsius version number should be 5.2.1.0. (Build 12,2,1,94)
Monday, October 26, 2009
Xcelsius 2008 Service Pack 2 Hot Fix Available
Xcelsius 2008 Service Pack 2 Hot Fix Available (SP2FP1) is now available and posted on the SAP Business Objects download support site. You can access it here:
Download from Here
Download from Here
Wednesday, September 23, 2009
Turning Dashboards Into A Reality --- Webinar
Turning Dashboards Into A Reality
Whether you use spreadsheet-based dashboards, or are evaluating a solution for the first time, you will discover key best practices in dashboard design and common enterprise work flows. You will also learn the benefits of connecting to live corporate data, and distributing secure, personalized dashboards over the Web or on the desktop.KEY TOPICS
- Benefits of enterprise dashboards versus static data presentations
- How to create dashboards connected live to enterprise data sources, such as SAP
- Tips, tricks, and best practices for creating stunning dashboards
- How to distribute secure and personalized dashboards to your employees, customers and business partners
Friday, September 11, 2009
Xcelsius Add ons availability websites
You can find free and cost base of Xcelsius Add on Components in following websites ...
http://xcomponents.blogspot.com/
information.ondemand.com/
centigonsolutions.com/
http://www.sdn.sap.com/
http://reportex.co.uk/xc_addons.html
http://www.inovista.com/samples/sampleMain.html
Update:-
New add on Drill down charts are available the following Site
http://www.martonhorvath.com/
Don't hesitate to add if you found new which is not listed in above .....
Tuesday, August 4, 2009
Xcelsius 2008 Service Pack 2
Xcelsius 2008 Service Pack 2(SP2) is now available and posted on the SAP BusinessObjects download support site. You can access it here:
Thursday, July 9, 2009


Tuesday, July 7, 2009
Use of Google Chart API In Xcelsius
In Xcelsius we dont have any 3d charts.. But we can get it by using google chart API.
In this post i'm going to explain how to use googl chart API in Xcelsius..
you can findout GOOGLE Chart API here
By passing URL parameters from your Xcelsius Model(Concatenate the cells)
http://chart.apis.google.com/chart?cht=p3&chd=t:60,40&chs=250x100&chl=Hello|World
the below SWF file shows the Google Chart api in Xcelsius
I will Upload Source file soon...
Export2Excel in Xcelsius
The Export 2 excel functionality in Xcelsius is available now
If you are using IIS Webserver please CLICK HERE.
If you are using Tomcat webserver CLICK HERE
Hope this is very usefull stuff..
Thanks to BI GURU and Luca Spinelli & Ivan Aguilar(ClearPeaks) for providing this.
We have another type of functionality Xport wizard that provided by Centigon Solutions .
but xport wizard is bit expensive compare with above two..
Simulate Excel conditional formatting in Xcelsius 2008
If you are trying to use the Spreadsheet component in Xcelsius and expecting it to function like a regular Excel spreadsheet, then I’m afraid you are wrong. Unfortunately Xcelsius doesn’t support Conditional formatting for the Spreadsheet component. However here is an alternative to achieve the same.
I used the rectangle component to simulate this functionality. Try the interactive model below and read the steps. I would recommend you to Download the Source Files at the end of this post and go through the steps while looking at the XLF model.
Steps to get it;
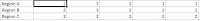
1 Create a sample sales data excel file.
2 Drag the Spreadsheet table component into the canvas and bind it to the resulted salespersons region values. After bind it to the display data we need to select the ROW and bind the source data and destination to the excel sheet.
3 A chart component placed on Canvas and the series is need to map the spreadsheet table component destination. Then go to alerts tab and just check enable to alerts option and go to Color order check the high values are good.

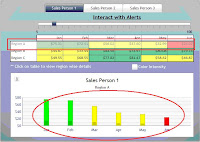
7.The above image shows the interactive with the table and Chart(Alerts)
I used the rectangle component to simulate this functionality. Try the interactive model below and read the steps. I would recommend you to Download the Source Files at the end of this post and go through the steps while looking at the XLF model.
Steps to get it;
1 Create a sample sales data excel file.
2 Drag the Spreadsheet table component into the canvas and bind it to the resulted salespersons region values. After bind it to the display data we need to select the ROW and bind the source data and destination to the excel sheet.
3 A chart component placed on Canvas and the series is need to map the spreadsheet table component destination. Then go to alerts tab and just check enable to alerts option and go to Color order check the high values are good.

4 Checking the values by using the formula
=IF(G23<30,1,if(and(g23>30,G23<70),2,if(g23>70,3,""))).
The above formula is checking the values are <30 color="#ff0000">Red color, sales>30 and<70 color="#ffff00">Yellow> color and sales>70 it displays the Green Color. This will check the every cell in the lookup values.The resulted values are as follows.

5.Then take three Rectangles (Red, Yellow and Green) and set the display status to 1-> red, 2->yellow and 3-> Green. That rectangles are placed before the table component(be careful while giving the Dynamic Visibility to rectangles).
6.The slider component is added for the interactive with the alerts.

7.The above image shows the interactive with the table and Chart(Alerts)
Multiple Series Insert in (Xcelsius)
This Post has been Updated..
The below example shows the how to simulate multiple series drill down in Xcelsius
How to do it
The below example shows the how to simulate multiple series drill down in Xcelsius
How to do it
Step 1:
Take a column chart and map the yearly data by using the “by range (data in rows)”.
Then you need to click on “by series” the chart will shows the yearly data.
Step 2:
Go to “DRILL DOWN” tab and check the “Enable Drill Down” check box…
Here you need to do carefully
A) Here we have to bind “Series Name Destination” to Sheet1! $G$1 cell(in fig1), It throws the Series name ‘a’,’b’,’c’.
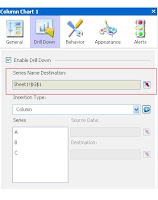
B) then the next step is Insertion type select insertion type as column. Click on Series “A and bind the source data with the Years(2007,2008,2009) and we need to do same for the B and C Series also. But we have to bind the destination of each series with different cells
Stpe 3;
Then come to Excel spreadsheet concatenate series names, we use this concatenated key as a search key for the monthly data (Fig2)
Then come to Excel spreadsheet concatenate series names, we use this concatenated key as a search key for the monthly data (Fig2)

Please Don't hesitate to comment it..
Monday, May 25, 2009
Subscribe to:
Posts (Atom)